Understanding Fight Odds
Introduction
If you are a UFC fight fan, you have likely noticed that the betting odds are often featured prominently in the lead up to a fight. This page is intended for those who want to better understand what the betting odds signify, how to interpret them, and how well they have predicted fight outcomes in past years.
After reading this page, you will be able to understand what Jon Anik means when he notes a fighter to be a “prohibitive favourite”, and why the commentators react so strongly to big upsets.
Types of Betting Odds
Betting odds are typically represented in one of three ways:
- Moneyline / American Odds (+140 vs. -160)
- Decimal Odds (2.40 vs. 1.63)
- Fractional Odds (7/5 vs. 5/8)
As a UFC fan, you would probably be used to seeing American Odds. We will focus on this format.
Understanding American Odds
American Odds are best understood from the perspective of either earning or betting $100.
As I write this, Lewis is slated to fight Blaydes on February 20, 2021.
According to www.bestfightodds.com, BetWay has Blaydes as a -400 favorite over Lewis who is listed as a 300 underdog.
This means that you need to bet $400 on Blaydes to make a $100 profit. Conversely, if you bet $100 on Lewis, you will make a $300 profit.

As you can see, your potential earnings are greater if you bet on Lewis. By definition, this makes Lewis the underdog and implies that Lewis should be less likely to win than Blaydes.
Simply put, the fighter associated with the negative number is the favorite. The larger the negative number, the more that fighter is favored to win.
Ok, but now you might be wondering, exactly how likely is Lewis (or Blaydes) to win? To answer that question, we’ll have to explore the Implied Probabilities of the American Odds.
Implied Probability
What exactly does it mean for a fighter to be a favorite? Well, as discussed, it means that you make less money betting on that fighter than you would betting on the underdog. But that is not all it means. More intuitively, it means that the fighter has greater than a 50% probability of winning. Conversely, the underdog has less than a 50% probability of victory.
We can use American Odds to derive the exact probability the favorite and underdog have of winning. These are called Implied Probabilities because they are not explicitly established probabilities of victory - they are probabilities implied by the amounts of money people are willing to bet on either fighter.
The following equation calculates the Implied Probability of the favorite:
Implied Probability Of Favorite = -American Odds / (-American Odds + 100)
The following equation calculates the Implied Probability of the underdog:
Implied Probability Of Underdog = 100/(100 + American Odds)
Using these equations, we can see that Blaydes has about a 80% probability of victory:
Implied Probability Of Blaydes = 400/(400+100) = 80
Conversely, Lewis appears to have approximately a 25% probability of victory:
Implied Probability Of Lewis = 100/(300 + 100) = 25
At this point, you may have noticed that something is wrong… The Implied Probabilities don’t add up to 100%! Indeed, 80% + 25% = 105%.
This is by design. The surplus of percentage points (in this case 5%) is referred to as the overround.
Overround
The overround guarantees that the oddsmaker (in this case, BetWay) turns a profit. By contrast, the overround makes it more difficult for bettors to earn money, especially in the long run. As a bettor, the odds are stacked against you.
However, you can overcome most of the disadvantage of the overround by selectively choosing the betting website that provides you with the best fight odds for your particular pick.
What is meant by “best fight odds”? Well, if you are betting $100 on an underdog, you will want to place your bet with the website that provides you with the largest positive number because that number describes the profit you could be making.
In our example, as noted above, BetWay has Lewis as a 300 underdog. However, according to www.bestfightodds.com, SportBet lists Lewis at +336. Therefore, if you bet $100 on Lewis with SportBet and he wins, you will make $36 more than you would have if you had placed your bet with BetWay.
Of course, $36 may not seem like much. However, if you compare the best odds (+336) for Lewis to the worst odds (+270 with SportsInt.), you have a $66 difference (for a $100 bet).
Often times, the difference between the best and worst odds for a given fighter will be larger when dealing with big favorites/underdogs (i.e. larger absolute numbers) than it will be for closer match-ups (i.e. smaller absoluate numbers).
NOTE: If you want to build an intuition for this, just spend a bit of time scanning the Moneyline / American Odds for a given UFC event listed on the www.bestfightodds.com website.
Over the long run, making sure you pick the best odds for your bets can have a big impact.
| You now have the basic tools required to understand the Vegas Odds for this upcoming UFC event. The remainder of the post focuses on the analysis of historical data of UFC fight odds to understand how underdogs and favorites perform in the long run. |
|---|
Dataset - Historical Data of UFC Fight Odds
Using data science tools such as web scraping, I have obtained a dataset with fight odds information regarding the majority of the UFC fights that occurred between 2013 and present.
In particular, the dataset consists of 2941 UFC fights from 261 UFC events, spanning from April 27, 2013 to February 06, 2021.
Among other things, the dataset lists the best odds for each fighter around the time of their fight, as well as the winner of each fight.
How much does picking the best odds make up for overround?
It almost completely makes up for the overround!
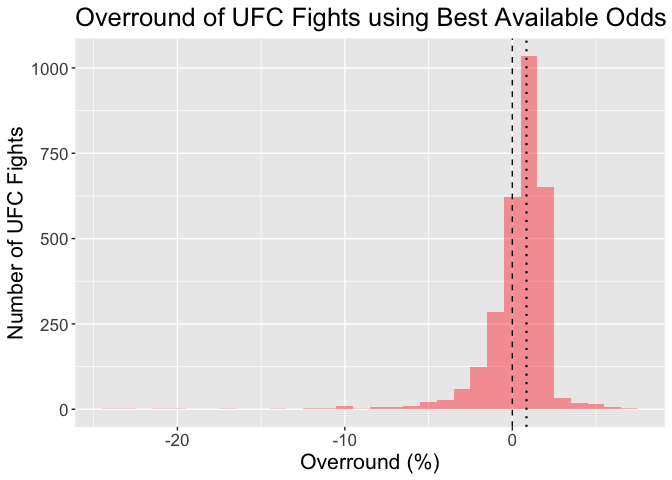
The average (median) overround in the dataset is 0.0084718, which is less than 1%.
The below graph shows the distribution of fight overrounds, based on best available odds. As you can see, the vast majority of fight overrounds lie between -5 and 5 percentage points. The dashed line corresponds to an overround of 0%, whereas the dotted line showcases the average overround of just under 1%.
Will I make money if I just always bet on the underdog?
No.
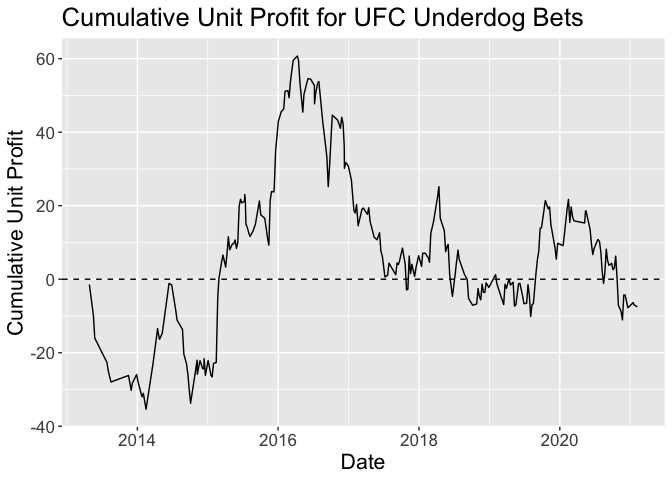
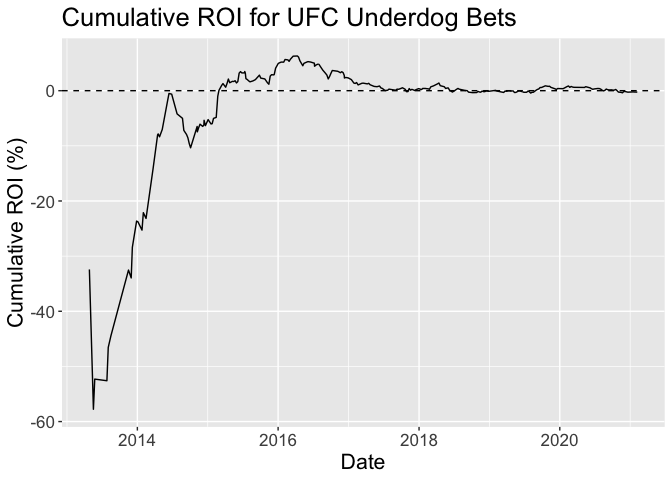
Well, at least not if the past predicts the future… Had you bet $1 on the underdog of every UFC fight (included in the dataset) you would have lost $6. Your return on investment (ROI) would have been -0.2%.
The below graphs simulate what your cumulative unit profit (profit if you bet $1 per fight) and cumulative ROI would have been had you bet on on the underdog (using the best available odds) for every UFC fight (from the dataset).
For my money, there does not appear to be any trend in the data…
Will I make money if I always bet on the favorite instead?
No.
Had you bet $1 on the favorite of every UFC fight you would have lost $67.92. Your ROI would have been -2.31%.
The below graphs simulate what your cumulative unit profit and cumulative ROI would have been had you bet on on the favorite for every UFC fight.
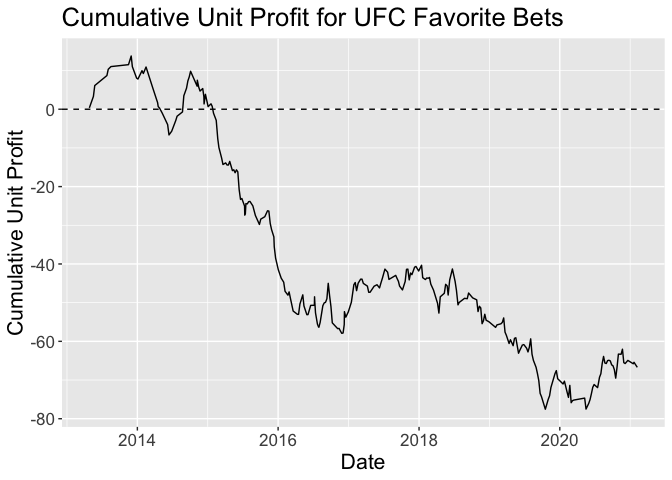
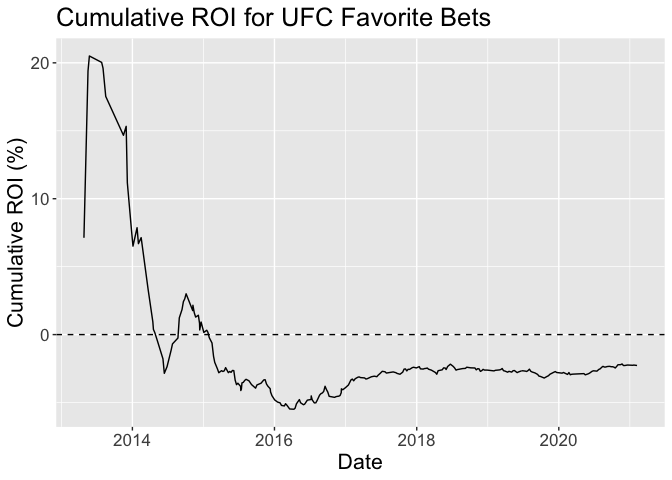
I believe the primary take away of the above graphs is that picking the best available odds and betting exclusively on underdogs or favorites is not a fruitful betting strategy. With that said, it does appear that picking underdogs produces better results, on average, than picking favorites.
The calculated ROIs for betting exclusively on underdogs or favorites are reasonably consistent with those listed at BetMMA.tips.
Are Fight Odds “Accurate”?
Basically, yes.
But what does it mean for the odds to be “accurate”?
Well, as noted earlier in this post, we can derive Implied Probabilities from fight odds. These probabilities are meant to represent the probability that a given fighter will win. Of course, a given fight only occurs once. For instance, there will be only one winner of the Lewis vs. Blaydes contest. We cannot get them to fight 100 times to see how often each of them wins. What we can do, however, is look at how the odds perform across fights. For example, if we look at all the fights for which the Implied Probability of the favorite was between 60-65%, we would expect that the favorite won 60-65% of the time. We can do this for the whole spectrum of Implied Probabilities to gauge the overall accuracy of the Fight Odds.
| NOTE: In order to get an unbiased sense of the Implied Probabilities of the best fight odds, we adjust for the overround so that the total probability of any given fight is 100%. As such, the findings in the below will make use of Adjusted Implied Probabilities. For simplicity, we will continue to refer to them as Implied Probabilities. |
|---|
The below graphs showcase this aforementioned spectrum. For both underdogs and favorites, I computed the actual probability of victory of fighters in various ranges of Implied Probabilities. In common statistical language, we refer to these ranges as “bins”. As such, the x coordinate of each black dot is simply the middle point of the bin it represents. The y coordinate is the probability of victory of all the fighters that fell within that bin. The smooth blue curve represents a basic statistical model that tries to fit a curve to the black dots. For our purposes, it gives us a better sense of the trend underlying the black dots.
The diagonal dotted line represents where we would have expected to data points to land if the odds were perfectly “accurate”. If the black dots and/or blue line falls below the dotted line, it means the fighters in the corresponding bin underperformed relative to the odds. Conversely, if the black dots and/or blue line rises above the dotted line, it signifies that the fighters in the corresponding bin overperformed relative to the odds.
As we can see, moderate favorites underperformed, whereas substantial favorites overperformed. Conversely, substantial underdogs underperformed, whereas moderate underdogs overperformed.
Having two graphs (one for favorites and one for underdogs) is a bit redundant in the sense that the results, by definition, will largely mirror each other. However, I believe having both graphs helps with interpretation.
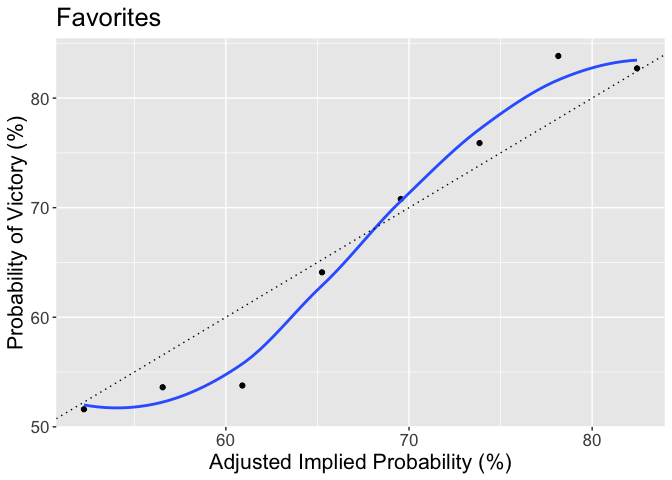
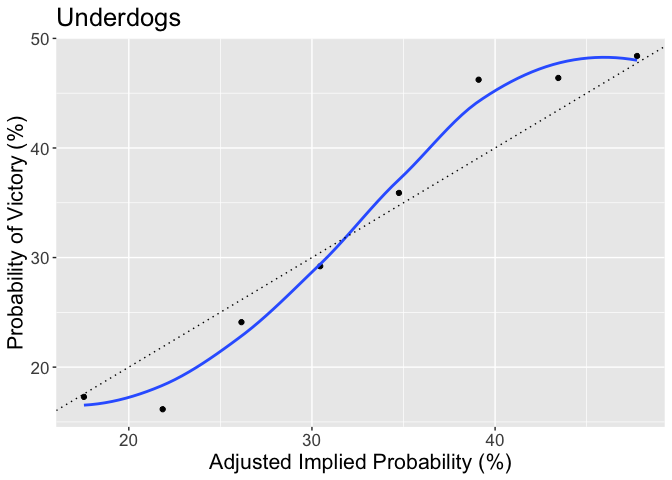
I believe the primary takeaway of the graphs is that the odds do a pretty good job of predicting who will win across multiple fights. With that said, the odds do appear to convey some bias whereby underdogs overperform in close match-ups whereas favorites overperform in disperate pairings.
According to BetMMA.tips, which noticed a similar trend, this bias may be a result of “bettors putting money on slight favorites and pushing out their odds beyond what should really be a pickem fight”. This certainly seems plausible to me.
Conclusion
In a sentence: fight odds are reasonably representative of a fighter’s chance of victory and it is difficult to make money betting on UFC fights.