How Accurate Are Fight Odds
Introduction
In a another post called Understanding Fight Odds, I described what the fight odds (specifically American Odds) signify and how to interpret them. I also briefly explored the question “Are fight odds accurate?” by looking at the relationship between the actual Probability of Victory of fighters and the Implied Probability of the fight odds that they were given (we’ll review these data later).
I had a smart ass friend point out that the trends found in the average relationship between actual Probability of Victory and Implied Probability may break down if we look at the relationships on a smaller time frame (e.g. year-to-year). This is actually a great point and will be, in part, the focus of this post. Specifically, I will look at how the performance of the odds varies across years and across methods of victory (i.e. TKO, Decision, etc.).
Dataset - Historical Data of UFC Fight Odds
Using data science tools such as web scraping, I have obtained a dataset with fight odds information regarding the majority of the UFC fights that occurred between 2013 and present.
In particular, the dataset consists of 2941 UFC fights from 261 UFC events, spanning from April 27, 2013 to February 06, 2021.
Among other things, the dataset lists the best odds for each fighter around the time of their fight, as well as the winner of each fight.
Let’s Review! Are Fight Odds “Accurate”?
The below graphs, analyzed in greater detail in a another post, showcase the relationship between the actual Probability of Victory of fighters and the Adjusted Implied Probability of the fight odds that they were given.
Compared to my another post, I added a couple graphs that allows us to look at the same data from a different perspective. I have added graphs that represent Over Performance instead of Probability of Victory on the y-axis. Over Performance is simply the difference between the black dots (or the blue lines) and the diagonal dotted line from the Probability of Victory graphs. If a black dot is above the dotted line, fighters in that odds bin overperformed. Conversely, if a black dot is below the dotted line, fighters in that odds bin underperformed.
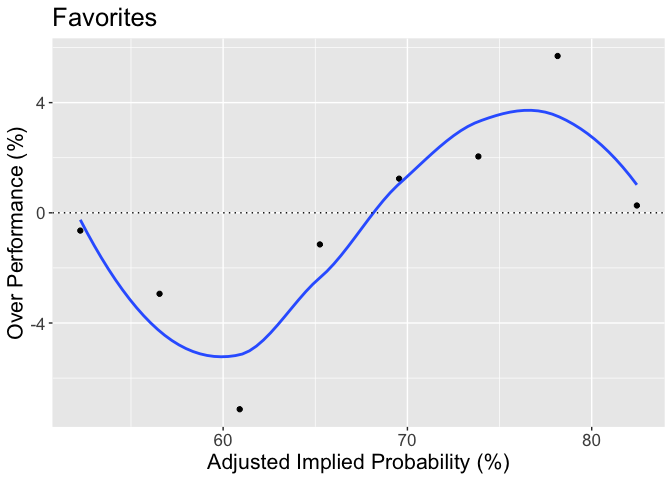
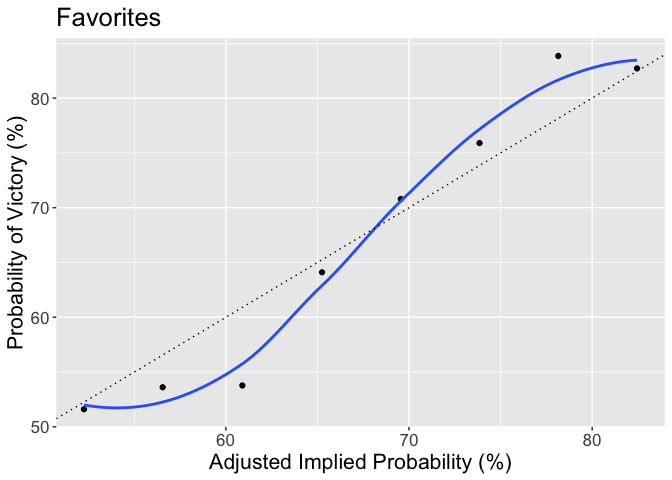
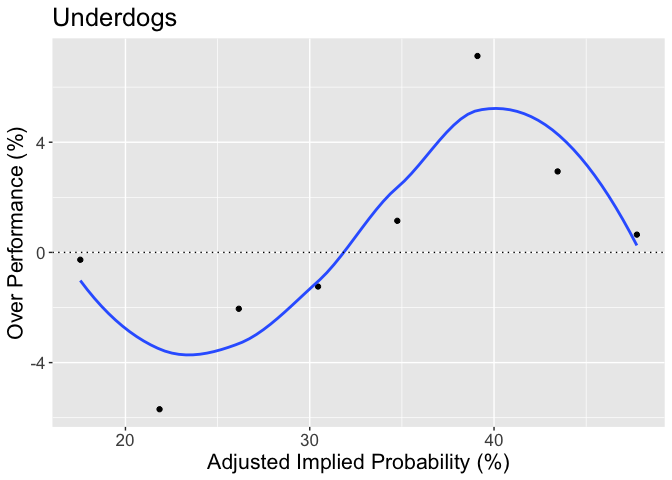
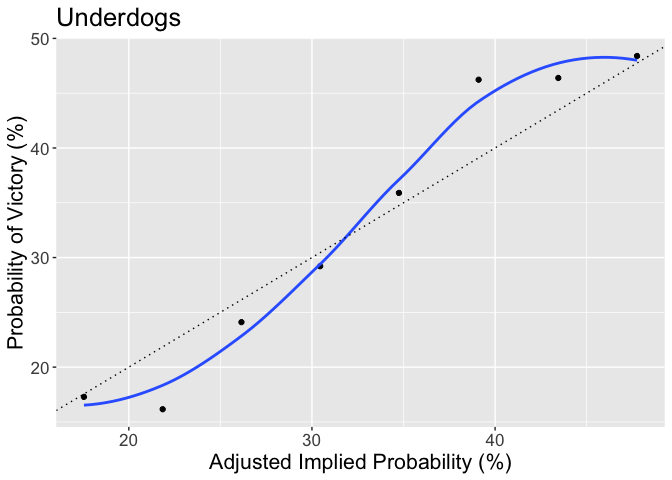
As discussed in a another post, the odds do a pretty good job of predicting who will win across multiple fights, but do appear to convey some bias whereby underdogs overperform in close match-ups whereas favorites overperform in disperate pairings.
Now, let’s break down the Over Performance graphs by year to see if the aforementioned bias holds…
Yearly Odds Performance
Oh boy. The graphs look like rainbow speghetti thrown at a wall.
Part of the reason the colored lines and dots look nearly randomly dispersed is that the amount of data going into any particular estimate (dot or line) is reduced. In the previous graphs, we had fight data from 2013 to 2020 going into 7-8 point estimates (dots). Now, that same amount of data has to contribute to many more point estimates (dots). The result is many unstable estimates as we see below. Indeed, averaging over many data, as we did in the above graphs, almost always makes the data look much nicer / smoother.
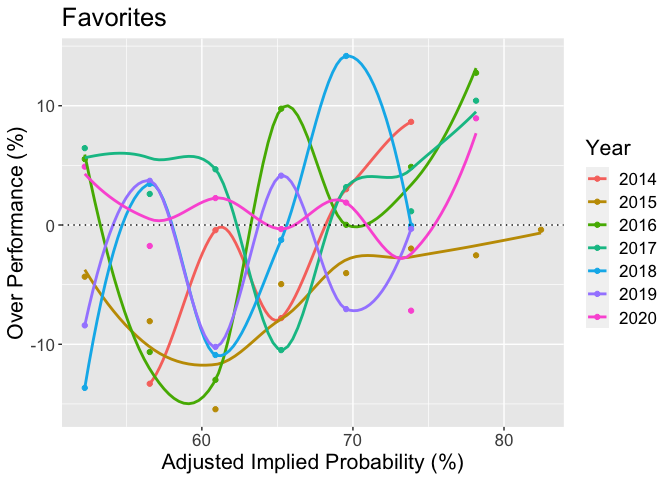
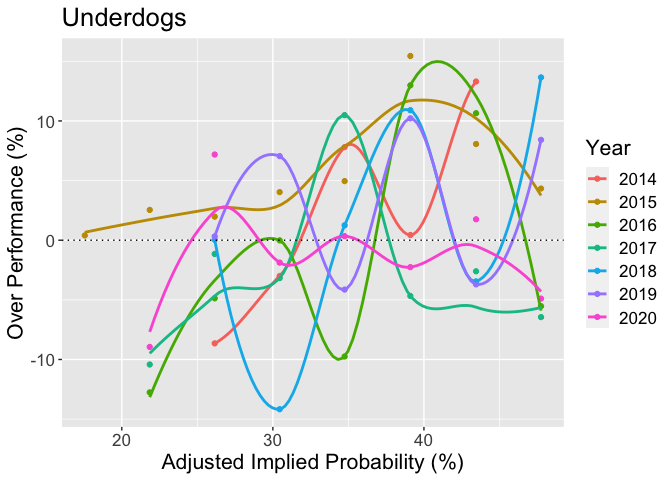
So what do we make of this? Well, had you tried to exploit the aforementioned bias by betting on underdogs with Implied Probabilities around 37%, you would have probably made some money most years, with the exception of 2016 and 2020.
Does that mean that you should start putting money down on moderate underdogs? Not quite. Although the average Over Performance across many years does point to an overarching trend, it is unclear that you could expect to get a reasonable return on investment by betting solely on moderate underdogs on any given year. The trend just does not seem that strong or stable.
Descriptive vs. Inferential Statistics
The above graphs are what most statisticians/scientists would refer to
as Descriptive Statistics.
Descriptive Statistics involve summarizing the data graphically, as well
as looking at averages and measures of variability (like standard
deviations).
Inferential Statistics involve using statistical models to generalize findings from the data, quantify uncertainty (e.g. how credible are these findings?), and make predictions.
In our case, we could use Inferential Statistics to determine the credibility of the aforementioned bias in the fight odds (i.e. is the bias “real” or just a statistical artifact). Perhaps more importantly, we could use Inferential Statistics to predict how well the odds will perform in future match-ups and determine our confidence in those predictions.
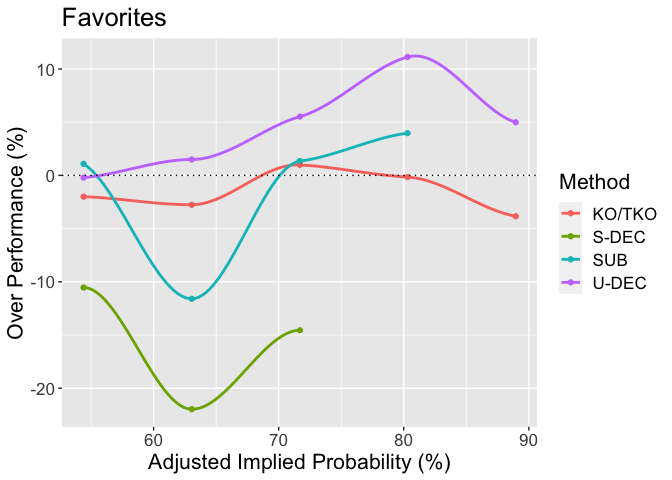
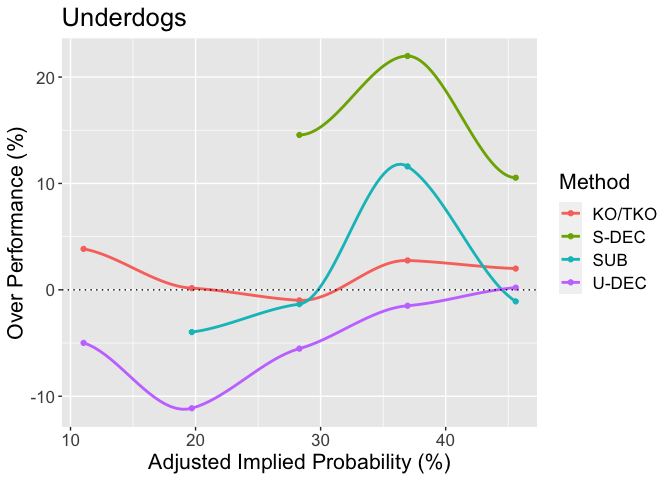
Relationship between Odds and Method of Victory
The below graphs display how the Over Performance curves differ based on the method of victory.
Looking at the Favorites graph, it is clear that favorites grossly underperform when fights go to Split Decisions (S-DEC). The reason for this may be that split decisions are basically toss-ups (50/50). Therefore, if a favorite makes it to a split-decision, they by definition have less of a chance of winning than the odds would have implied.
Sticking with the Favorites, it looks like favorites generally overperform when fights go to Unanimous Decisions (U-DEC). This seems intuitive since the favoured fighter is typically considered the “better” fighter in some holistic sense. Therefore, when the fight goes the distance, they should be more likely to have out-pointed their opponent (even when taking the odds into account).
Conversely, looking at the Underdogs graph, underdogs may be more likely to overperform than favorites when the fight ends with a finish - TKO or Submission (SUB). Digging a bit deeper, it seems like moderate underdogs (~35%-40%) overperform when the fight ends in a submission, whereas prohibitive underdogs (<20%) overperform when the fight ends in a KO/TKO. The latter finding plays into our intuition of a “puncher’s chance”.
Do Odds Predict Method of Victory?
Now that we have assessed how overperformance varies with the method of victory, as a last order of business, let’s see how the odds predict the method of victory. Are certain fight outcomes (e.g. KO vs. Unanimous Decisions) more likely if a fighter is heavily favored over another?
The below graphs allow us to answer this question by plotting the relative probability of various methods of victory as a function of the fight odds.
It looks like if the odds are fairly close (30%-70% of victory), the relative probabilities of the method of victory look something like:
- KO/TKO: ~30%
- Unanimous Decision: ~40%
- Submission: 15%-20%
- Split Decision: 10%-15%
However, when the odds become more disperate - big favorites (>75%) and big underdogs (<25%) - the relative probabilities of the method of victory look a bit different:
- KO/TKO: ~40%
- Unanimous Decision: ~35%
- Submission: >20%
- Split Decision: ~5%
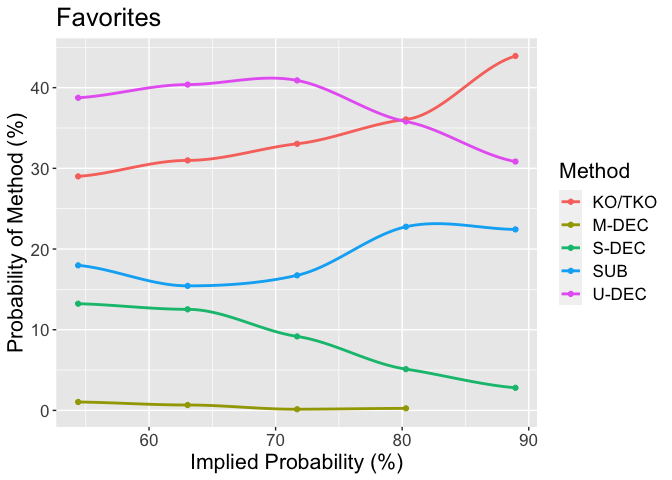
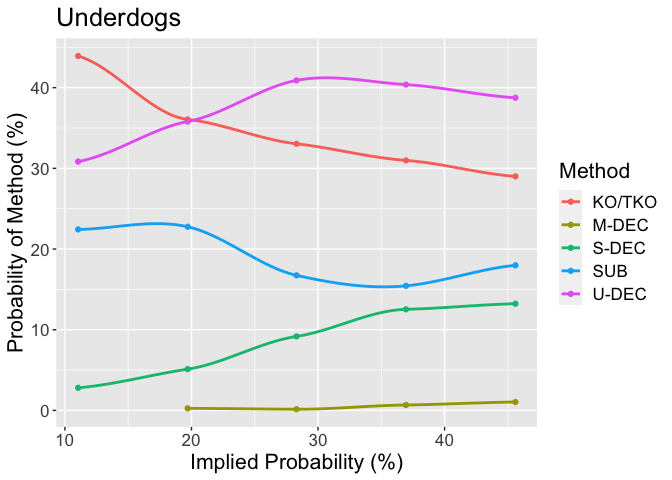
The primary take-away from the above graphs should seem fairly intuitive: bad match-ups (big underdog and big favorite) have a greater probability of ending as a finish (i.e. TKO or SUB) than do closer match-ups (moderate underdog and moderate favorite).
Conclusion
The apparent overarching bias whereby moderate underdogs overperform varies a lot from year to year.
Also, favorites generally tend to overperform when fights go to decision, unless it goes to split decision, in which case the favorites drastically underperform with respect to the odds. On the flip side, there may be something to this idea of big underdogs having a “puncher’s chance” since they tend to overperform when the fight ends in a KO/TKO.
Finally, bad match-ups (big underdog and big favorite) are less likely to end in a decision / more likely to end in a finish (i.e KO/TKO or Submission).